What It Does
Watcher runs on your cluster 24/7. It catches crashes, resource spikes, and health check failures. When something breaks, it figures out why and sends you a Slack alert with a diagnosis and a fix button. That’s it. No dashboards to babysit, no runbooks to follow, no pager rotation. Available on Pro and Team plans.Setup
Tell Monk to set up Watcher:- An active cluster with at least one non-local node
- A Slack webhook URL (optional — Watcher works without it)
How It Works
Watcher deploys two components to your cluster:- watcher-agent — polls your nodes and workloads, collects metrics, spots problems
- watcher-ai — analyzes what went wrong, writes recommendations, fires Slack alerts
- Detect. Continuous polling catches a threshold breach, crash loop, resource contention, excessive logs, or infrastructure instability.
- Analyze. AI reads the logs, metrics, and context. It figures out what happened and why.
- Alert. You get a Slack message with the diagnosis, severity, and a recommended fix.
- Fix. Click Fix with Monk in the alert. Monk opens a chat session preloaded with full context and starts remediation.
- Recover. When the issue clears, you get a recovery notification.
Slack Integration
During setup, Monk asks if you want Slack alerts. Say yes and it’ll ask for your webhook URL. It’s collected securely — never shown in chat. To create a Slack webhook:- Go to Slack Incoming Webhooks
- Create a new webhook for your workspace
- Copy the URL
- Paste it when Monk asks
Slack Alert Format
Issue detected:Fix with Monk Button
Every alert includes a Fix with Monk button. Click it and:- Your IDE opens with the Monk extension
- The chat panel loads with full context — affected workload, logs, metrics, AI diagnosis
- You tell Monk to fix it. It already knows what’s wrong.
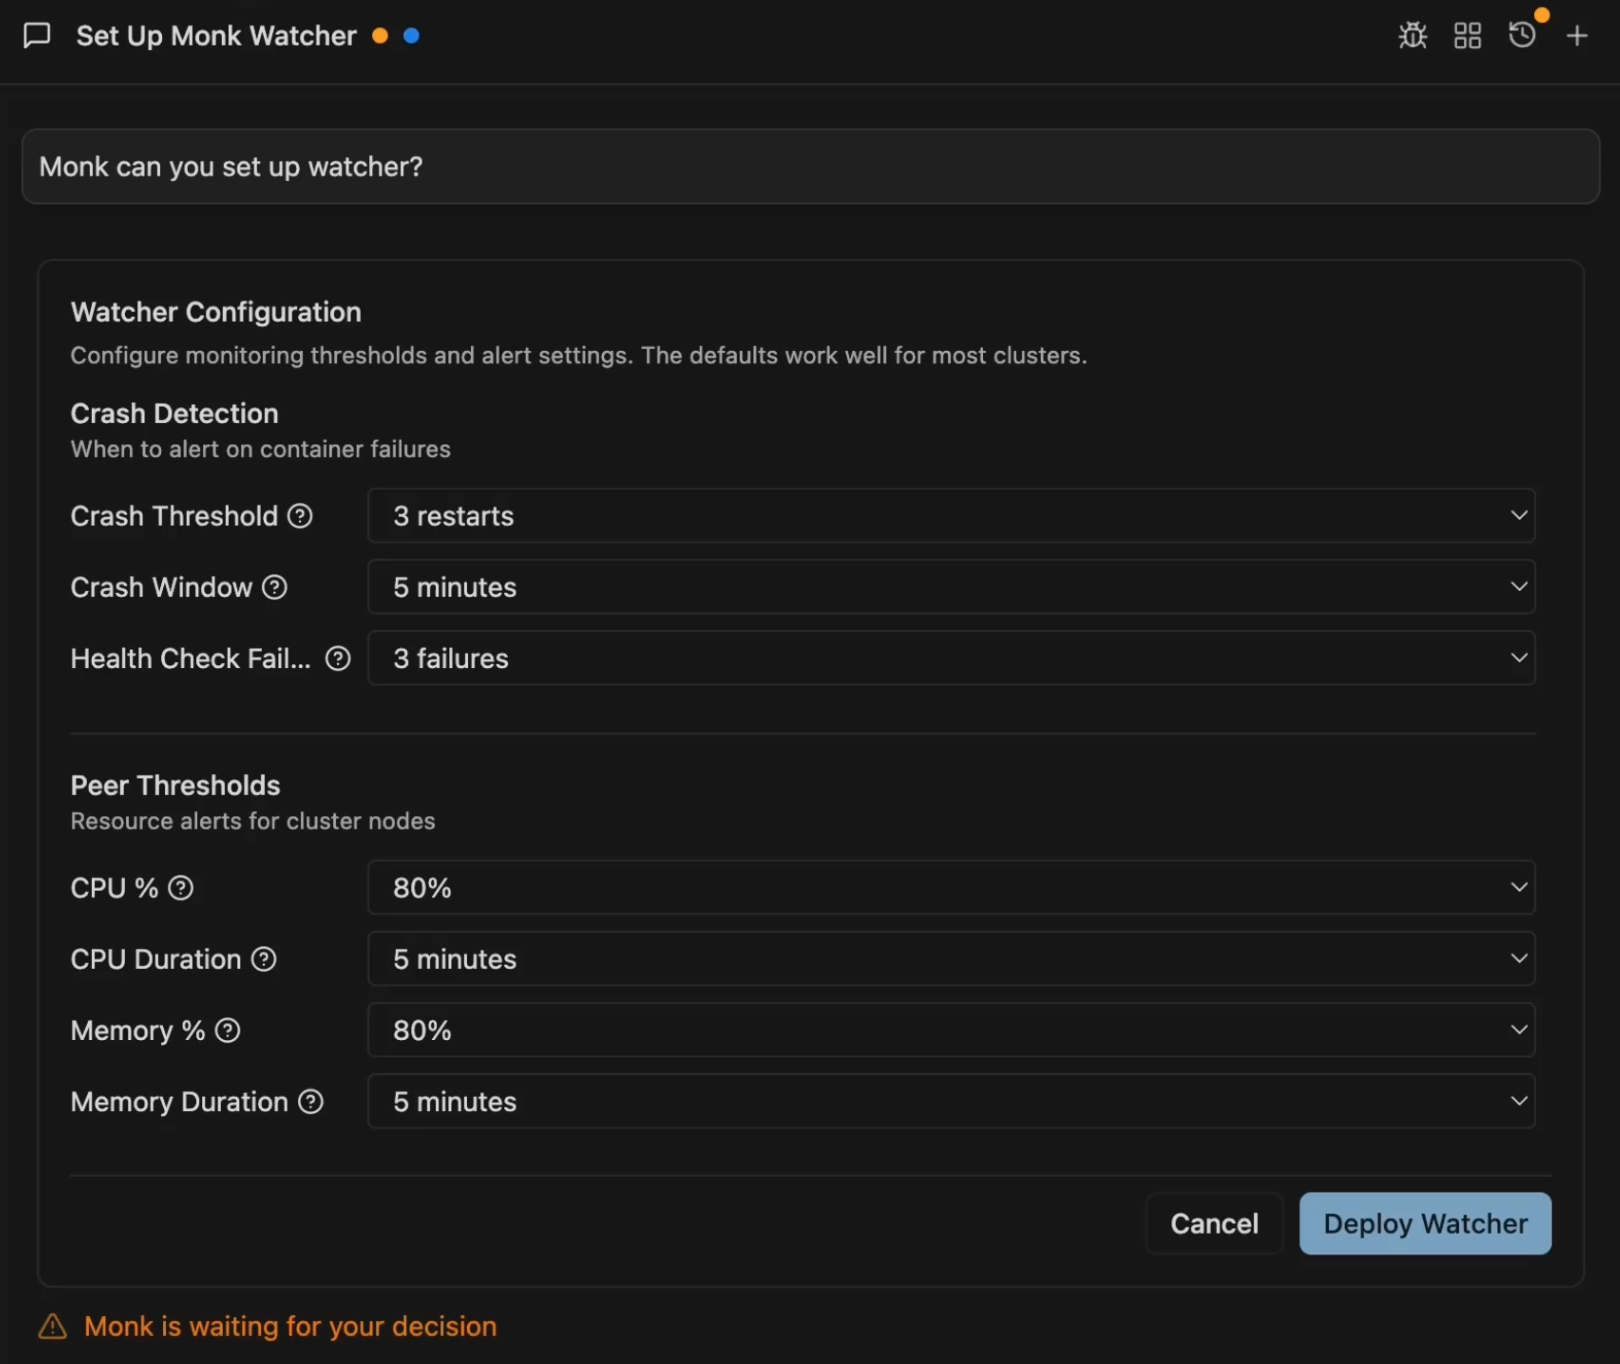
Configuration Options
The setup form has four sections:Crash Detection
- Crash Threshold: Restarts within the window to trigger an alert (default: 3)
- Crash Window: Time window for counting restarts (default: 5 minutes)
- Health Check Failures: Consecutive liveness failures before alerting (default: 3)
Peer Thresholds (Cluster Nodes)
- CPU %: Usage threshold (default: 80%)
- CPU Duration: Sustained time before alerting (default: 5 minutes)
- Memory %: Usage threshold (default: 80%)
- Memory Duration: Sustained time before alerting (default: 5 minutes)
- Disk %: Usage threshold (default: 85%)
- Disk Breaches: Consecutive polls above threshold before alerting (default: 2)
Workload Thresholds (Running Services)
- CPU %: Usage threshold (default: 80%)
- CPU Duration: Sustained time before alerting (default: 5 minutes)
- Memory %: Usage threshold (default: 80%)
- Memory Duration: Sustained time before alerting (default: 5 minutes)
- Disk %: Usage threshold (default: 90%)
- Disk Breaches: Consecutive polls above threshold before alerting (default: 3)
Advanced Settings
Toggle “Show Advanced Options” to access:- Poll Interval: How often to check cluster health (default: 15 seconds)
- AI Only Slack: Only send AI-analyzed alerts to Slack, cuts noise (default: on)
- Enable Fix with Monk: Include debugging links in Slack alerts (default: on)
- Ignore Local Peer: Skip local node checks, focus on remote peers (default: on)
- Context TTL: How long to keep alert context for debugging links (default: 24 hours)
- Reassess Interval: How often to re-evaluate ongoing issues (default: 15 minutes)
- Log Lines: Number of log lines to analyze per workload (default: 100)
Managing Watcher
Check status:Autonomous auto-fixes — automatic restart, auto-scaling, smart rollback — are on the roadmap. Vote on what to prioritize.
Monitoring & Observability
Log streaming, metrics, and troubleshooting from your IDE.
Scaling
Scale resources when Watcher detects sustained pressure.